
Howdy Readers 🥰

In this newsletter, you’ll find:
⚖️ Nielsen just changed the ruler your CTV buy is measured against
🎯 Pinterest and LinkedIn are finding better signals of buying intent
🏆 Ad of the day
If you’re new to ScaleUP then a hearty welcome to you. You’ve reached the right place along with 50k+ CEOs, CMOS, and marketers. Let’s get into it, shall we? Oh! Before you forget, if someone forwarded this newsletter to you, don't forget to subscribe to our newsletter so you never miss out!
Together with Insense
DTC marketers: Your FREE Sept→Jan creator playbook for BFCM + Q5

By October, CPMs can already be 20–60% higher. Waiting until November leaves your team buying expensive attention while still chasing creators, approvals, and usable content.
Insense’s free BFCM + Q5 Creator Marketing Playbook gives DTC marketers a week-by-week plan from September through January, so every creator campaign starts with a clear deadline and purpose.
Inside, you’ll learn how to:
Adapt to four shifts that have changed how Q4 is won this year
How to source the right creators within 48 hours
Time organic and paid social campaigns across BFCM and the overlooked mid-December-to-January Q5 window.
Get the free playbook and turn the busiest selling season into a campaign your team can execute without last-minute scrambling.
Insense is the creator engine for consumer brands scaling past $2M, looking to save 40+ hours on creator operations per month - especially in Q4.
Book a free strategy call by October 2nd and get $200 towards your first campaign.
⚖️ Nielsen just changed the ruler your CTV buy is measured against
Nielsen confirmed a major adjustment to its Big Data + Panel system, the audience measurement backbone behind most linear and streaming TV buying, on August 31.
The update touches universe estimates, household demographic assignment, weighting, Spanish-dominant Hispanic representation, and ACR tuning for one major data provider.
That’s a change to the denominator every TV and CTV audience number gets measured against, meaning any reach or demographic comparison spanning that date compares two different measurement systems, not two periods of the same buy.
The research record doesn’t yet show how much specific numbers will move.
What’s already clear is the mechanic: a CTV campaign that delivered a certain reach or demographic composition in August can show a different number in September for reasons that have nothing to do with the media plan and everything to do with how Nielsen now assigns and weights that same TV audience.
Flag every CTV comparison that straddles August 31
Any report comparing linear or streaming performance before and after that date is implicitly comparing two versions of the same measurement system, and the gap won’t be visible unless someone checks for it.
Pull your CTV and linear reporting cadence and mark every planned comparison crossing the boundary:
month-over-month reach, quarter-over-quarter demographic composition, year-over-year upfront benchmarks. Flag those for a second look before anyone draws a conclusion from the movement alone.
Check whether your streaming audience is disproportionately affected
The changes aren’t uniform across every segment. Improved Spanish-dominant Hispanic representation and refined ACR tuning for one provider mean some CTV plans see a bigger shift than others, depending on who a brand is actually buying reach against.
If your media plan leans on Hispanic household reach or the ACR-based streaming providers affected by the tuning change, expect a larger swing than a plan built on a generic linear buy, and don’t assume a flat adjustment applies evenly across every screen.
Rebuild your CTV baseline going forward
Bridging old and new TV audience numbers with an estimated correction factor is understandable and risky, since nobody outside Nielsen has the data to calculate that correction with confidence.
Treat September onward as a new baseline for linear and streaming reporting, not an extension of the old one.
Measuring CTV and linear performance against outcomes, incremental conversions and downstream revenue, rather than reach or demographic composition alone, is what survives a measurement change like this one.
That’s the model Tatari runs on. Its platform ties linear and streaming spend to site visits, conversions, and incremental revenue, so the number you judge a TV buy by comes from your own business, not from an audience panel that just redrew its weights.
When the ruler moves, an outcome-based read of the same campaign doesn’t. You can see how Tatari measures TV.
The CTV buy didn’t change on August 31. The ruler measuring it did, and most reports on your desk won’t say so.
🎯 Pinterest and LinkedIn are finding better signals of buying intent
Pinterest is bringing ads directly into visual discovery and using AI to help shoppers imagine products in their homes, while LinkedIn is helping B2B advertisers identify which target companies are already showing interest.
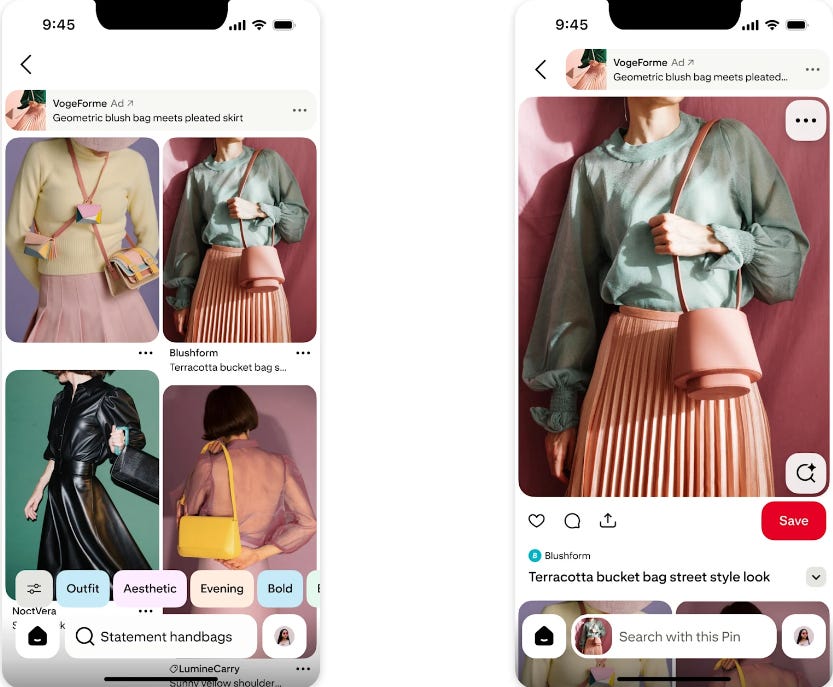
Pinterest Turns Visual Discovery Into an Ad Opportunity
Visual search ads will place sponsored products inside image search results and Pin close-ups. Pinterest says users conduct 80+ billion searches every month, with the vast majority being visual.
Pinterest’s new Restyle feature uses AI to reimagine rooms with different styles and products before purchase. Performance+ is also getting Priority Products, self-serve A/B testing and app-install campaigns.
LinkedIn Helps Advertisers Find Their Warmest Accounts
Campaign Manager’s Companies hub shows which businesses are engaging with a brand across organic posts and paid ads. Marketers can connect CRM data and filter by engagement and job seniority to see whether decision-makers are being reached.
LinkedIn recommends retargeting companies showing stronger engagement and tracking their response to follow-up campaigns. Its advice: “watch which of those companies start engaging” and then nurture those accounts through the funnel.
Both updates help advertisers move beyond broad audience targeting toward stronger intent signals. Pinterest can reach consumers while they visually explore potential purchases, while LinkedIn can help B2B teams concentrate follow-up spending on companies already engaging with their brand.
🏆 Ad of the Day

What Works:
Texture Becomes Proof - The zoomed skin window turns “bounce-back texture” into visual evidence, helping shoppers understand the product promise while making the cream’s sensorial payoff feel immediate.
Tech Aesthetic Differentiates - The code-style labels and interface boxes create a strong pattern interrupt, giving the skincare creative a more clinical, modern feel while keeping cognitive load controlled.
Usage Builds Confidence - The three-step application guide removes ambiguity around how to use the cream, while the model, product jar and “plump skin” cue reinforce both routine and desired outcome.
Overlay product visuals with interface-style labels that point to texture, application and outcome. It turns a beauty image into educational proof without losing premium appeal.
Advertise with Us
Wanna put out your message in front of over 50,000 best marketers and decision makers?
We are concerned about everything DTC and its winning strategies. If you liked what you read, why not join the 50k+ marketers from 13k+ DTC brands who have already subscribed? Just follow this.
At ScaleUP, we care about our readers and want to provide the best possible experience. That's why we always look for ways to improve our content and connect with our audience. If you'd like to stay in touch, be sure to follow us EVERYWHERE🥰
Thanks for your support :) We'll be back again with more such content 🥳